Meet Shams. The AI agent that runs solar and storage operations with you.
Shams works on your live SCADA, inverter, and battery data. It explains faults in plain language, forecasts soiling, tracks battery health, and drafts the tickets and cleaning plans your team approves. Nothing ships without your sign off.
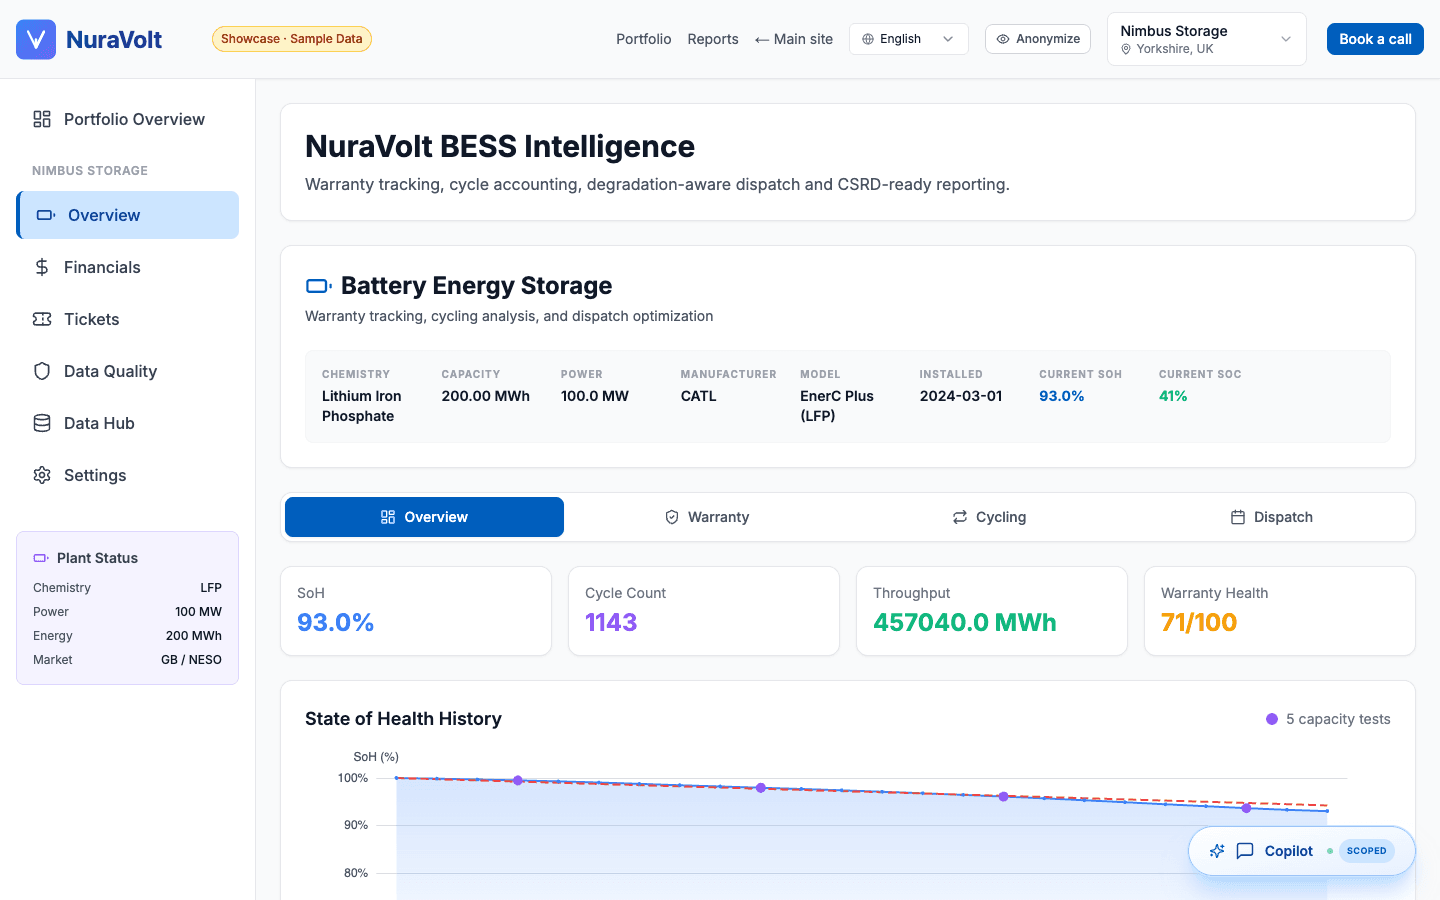
Continuous SoH, equivalent-cycle accounting, and warranty defense, on your live data. Or get a one-off audit.
Plug NuraVolt into your live SCADA, BMS, and inverter data. Track SoH trajectory, equivalent-cycle accounting, degradation-aware dispatch, and CSRD-ready evidence, every day. Prefer a fixed-scope diagnostic first? We run those too.
See the platform on real assets
Three blind spots that quietly destroy battery value
BESS operators see gross revenue. They rarely see what each megawatt-hour actually cost the asset, until the warranty review or the EOL test.
The degradation blind spot
Trading desks see the gross arbitrage spread. They almost never see the cost-per-cycle the battery just paid to earn it. Net revenue after degradation is a different number entirely, and the gap compounds every dispatch decision until the next capacity test reveals it.
Warranty discovered at claim time
Equivalent-cycle caps, SoC dwell limits, C-rate envelopes, temperature windows, every OEM warranty bakes in a dozen conditions, none of which your monitoring tool tracks against the contract. By the time a claim fails, the stress events are years old and unrecoverable.
Dispatch is leaving money on the floor
The right cycle at the wrong depth or temperature can wipe out the entire margin. Degradation-aware dispatch chooses which spreads to chase based on what they actually cost the asset, quietly recovering double-digit percentages of net revenue without spending a euro on CAPEX.
We instrument SoH trajectory, equivalent-cycle accounting, warranty compliance and degradation-aware dispatch on your actual operating data, and bake the evidence trail into CSRD- and EU-Battery-Regulation- ready reports. PV operators get the same treatment for soiling, fault detection and portfolio analytics.
What we build for you
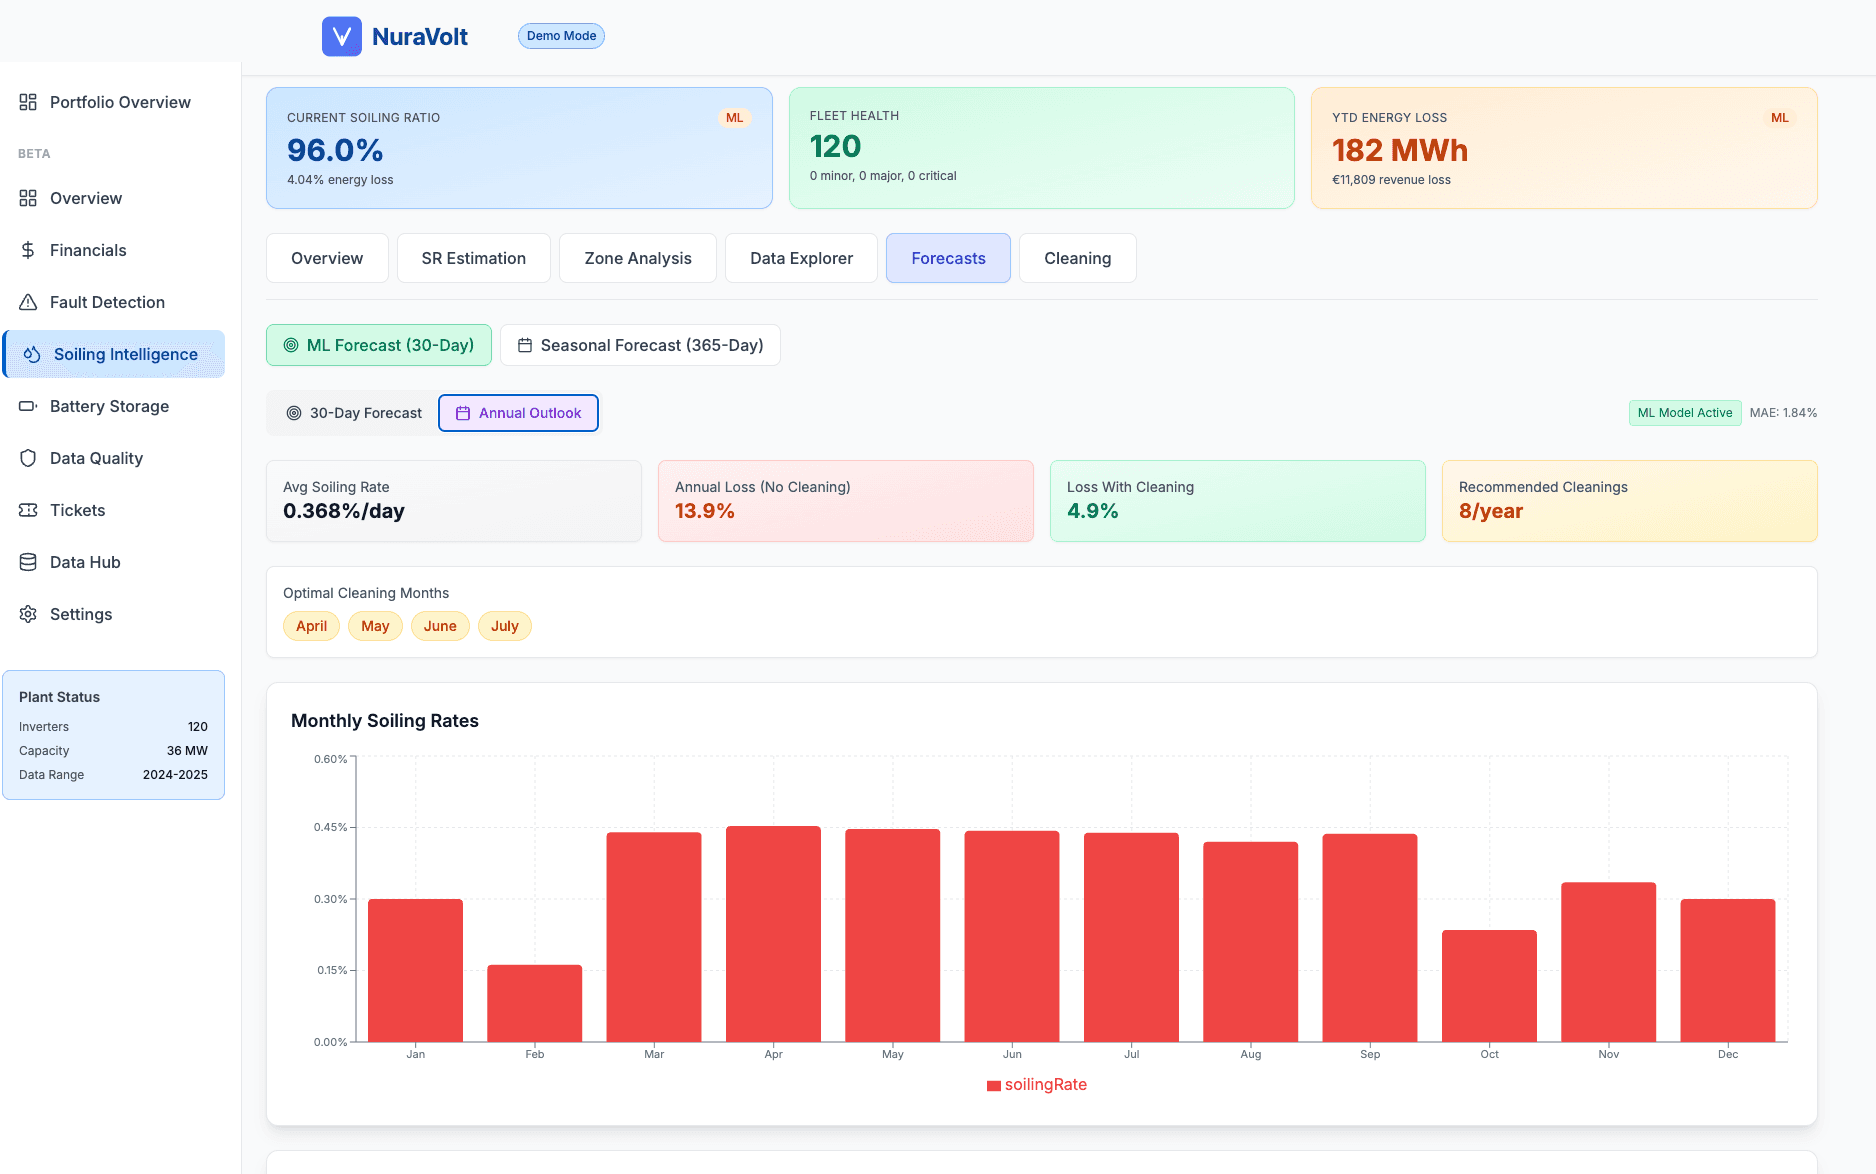
Soiling intelligence
365-day soiling forecasts powered by physics-ML hybrid models. Optimise your cleaning schedule based on actual revenue impact, not guesswork.
- Disaggregate soiling from other losses
- Zone-level analysis across your fleet
- ROI-optimised cleaning schedules
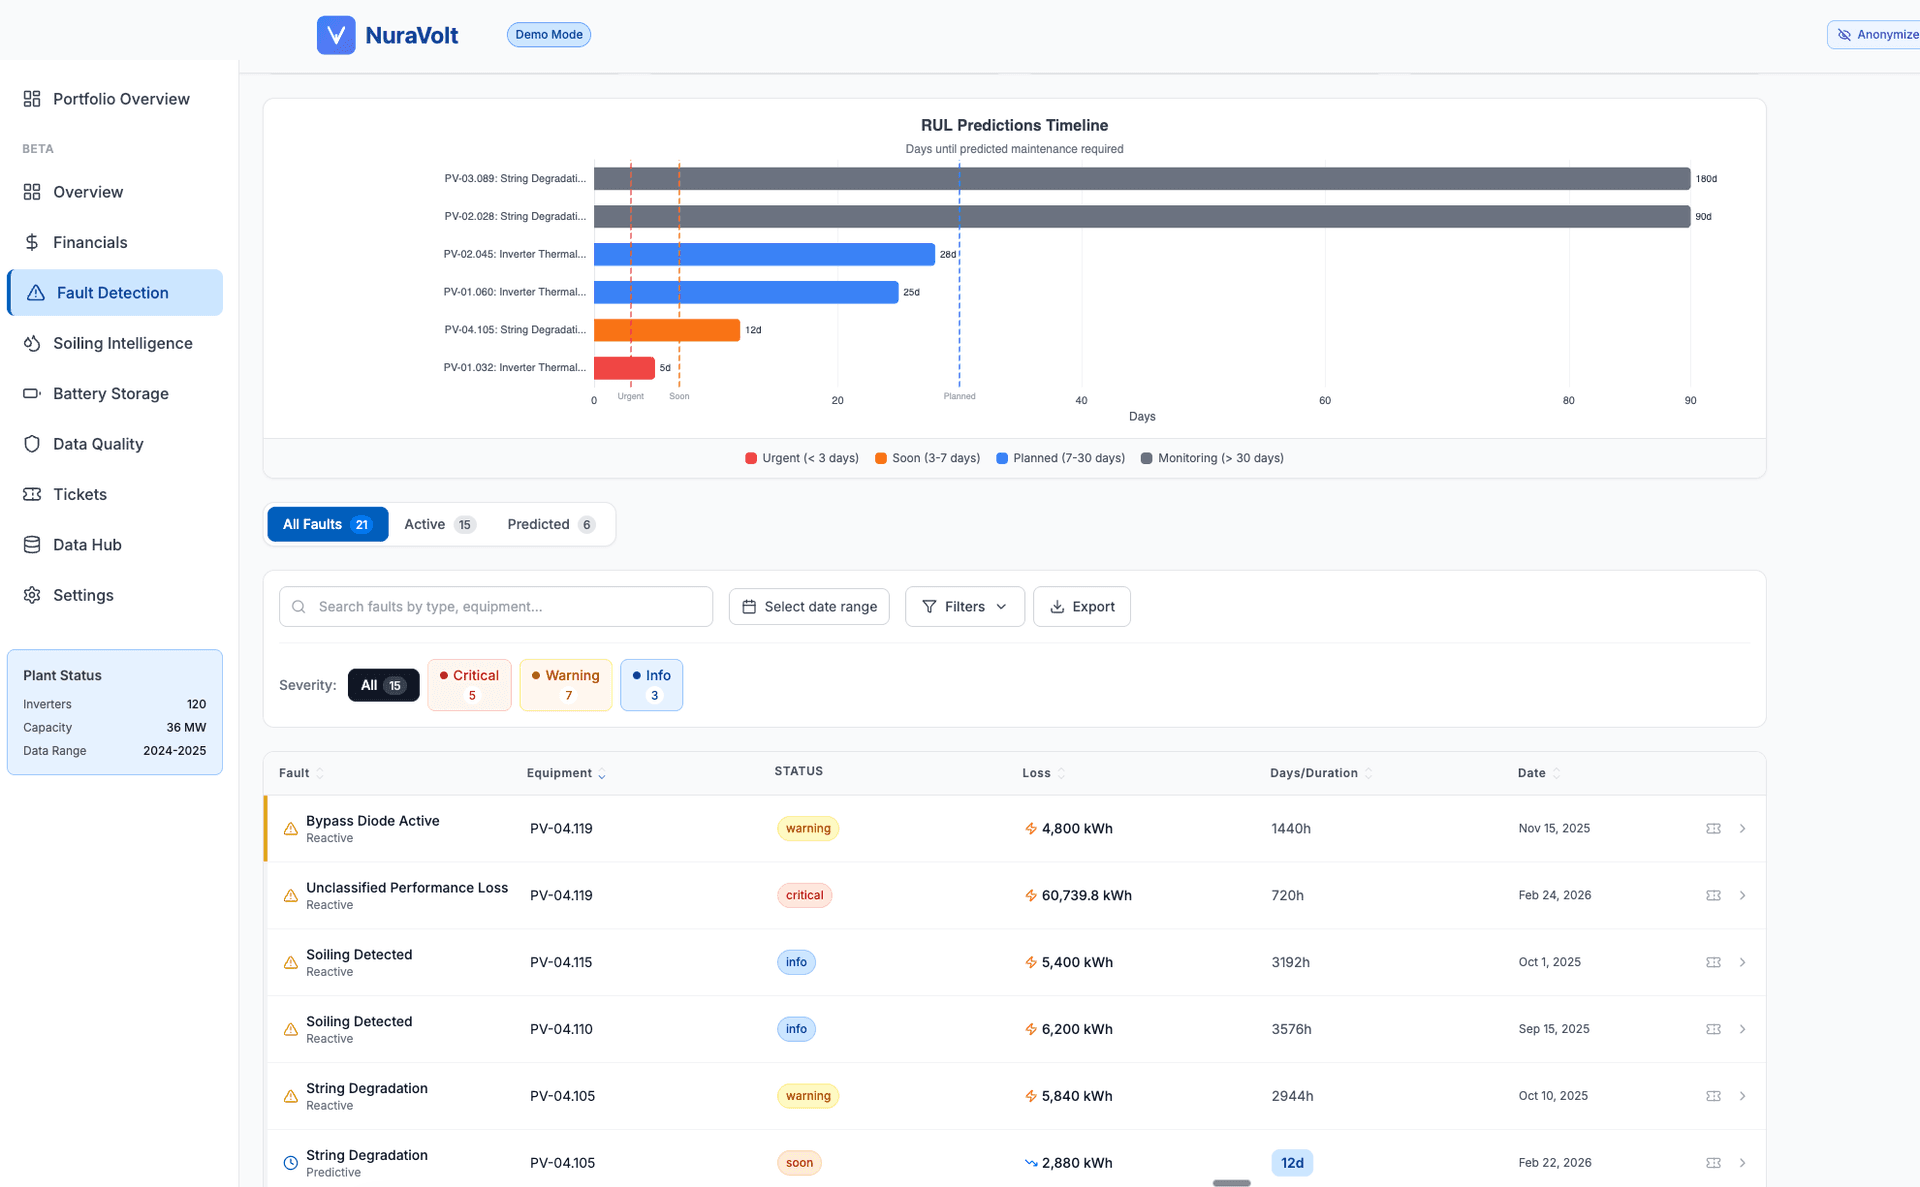
Predictive fault detection
Catch inverter failures, thermal degradation, and string issues weeks before they cause downtime. Prioritised by revenue impact.
- Thermal RUL predictions for every inverter
- Digital twin anomaly detection
- Automated severity classification
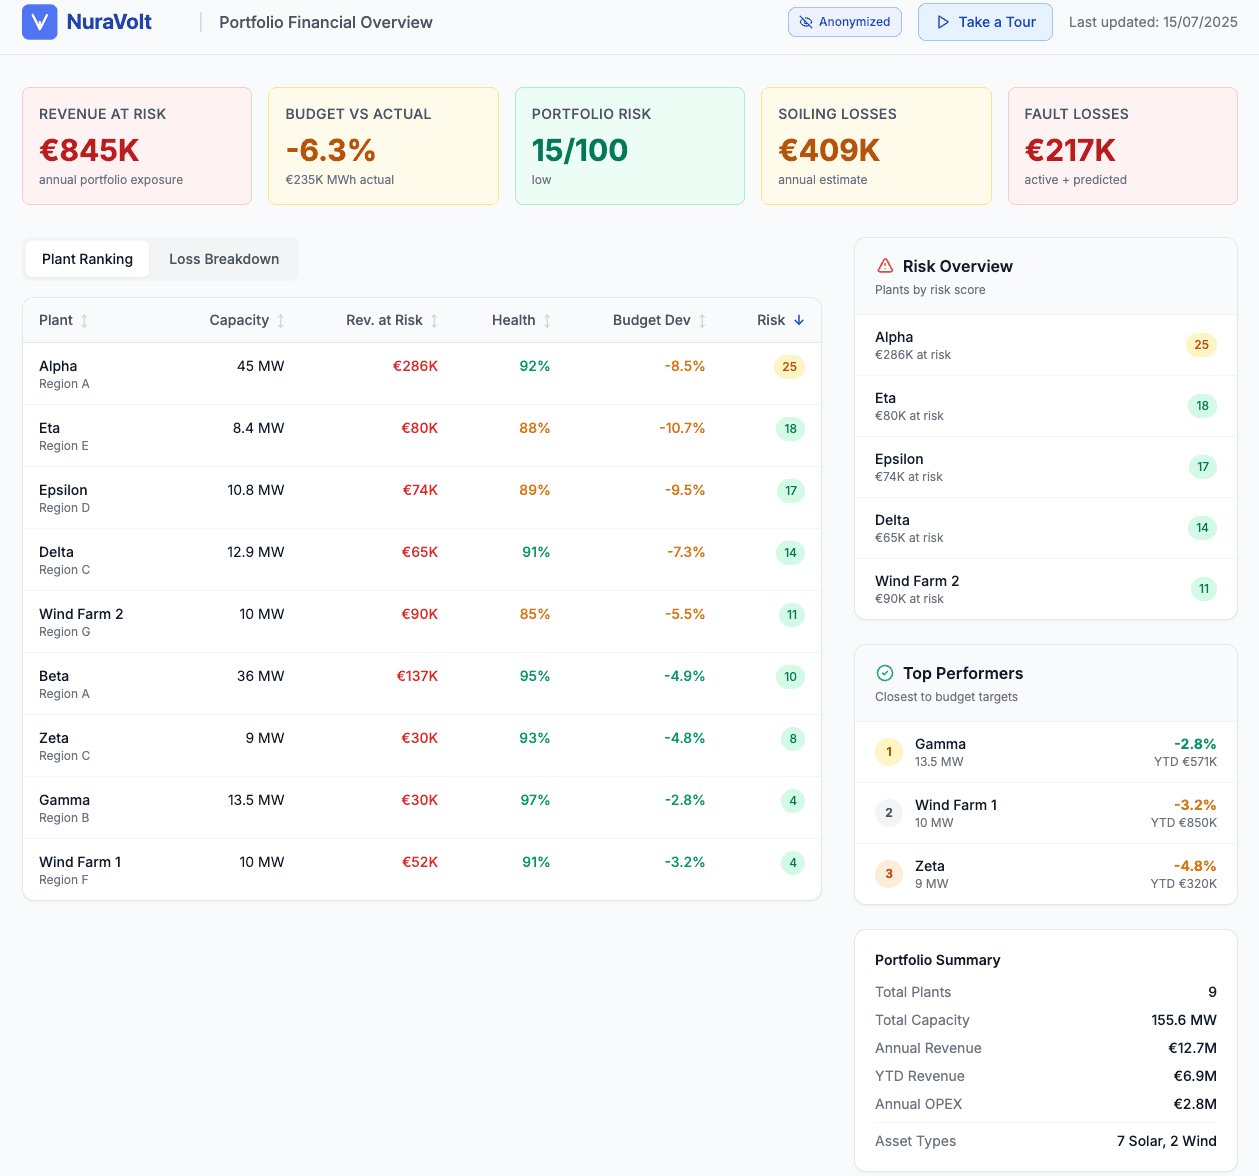
Portfolio analytics
See revenue at risk across your entire fleet. Track budget deviation, health scores, and performance rankings in one view.
- Plant-level risk scoring
- Budget vs actual tracking
- Financial loss attribution
From your data stream to a priced recommendation, in one panel
Every engagement runs the same loop: ingest your data, annotate the chart where money is leaking, and price the recommendation in €/day so the finance team can read it. Continuous on monitoring; a one-shot pass on a fixed-scope audit. No black-box scoring.
Schedule cleaning for the east string by 2026-06-14. Payback in under 7 days at current EUR/MWh.
Smaller plant. No SCADA. Or a SCADA that doesn't give you the data you need.
For PV and BESS sites under ~20 MW, we run the read-side data layer for you. Plug into your inverters, BMS, meters, and exports, and get a normalized, queryable stream you (or we) can build on.
Read-side ingestion
Modbus TCP, OPC UA, MQTT, inverter clouds (Huawei, SMA, Sungrow, Fronius, SolarEdge, Enphase), CSV, InfluxDB. Whatever you already have. No on-site hardware changes.
Normalized + queryable
Register mapping, unit validation, timezone reconciliation. Timestamped, normalized, queryable. SCADA-grade telemetry without the SCADA.
Stop here, or scale up
Use it as a standalone data layer for your own analytics. Or layer NuraVolt monitoring on top later when you're ready.
Continuous monitoring, a one-off audit, or a Data Foundation engagement.
Pick the path that fits, most operators start with continuous monitoring. A fixed-scope Plant Performance Audit (from €1,000) is the diagnostic option. Data Foundation is the read-side data layer for smaller plants. Tell us about your asset; we'll reply within 24 hours.
Irradiation data quality, validation methods for reliable operations
Free 5-page technical guide on sensor calibration and validation techniques for desert climates
Shams, in Claude. In ChatGPT. In Cursor.
The same fifteen tools Shams uses inside the platform, callable from any MCP-aware assistant. Ask your plants questions from wherever your team already works.
The engineering reference behind the platform
Plain-English explanations of the metrics and fault modes we monitor, the same definitions our physics-informed models run on.
MCP Server
Query NuraVolt from Claude, ChatGPT, Cursor
Data reports
Open benchmarks on public solar and battery data
Compare platforms
Honest comparisons: sensors, vendors, alternatives
By country
South Africa, Kenya, Nigeria, Spain, KSA, UAE
BESS metrics
SoH, RTE, augmentation, LCOS, warranty math
PV metrics
Performance Ratio, CUF, specific yield, availability
Fault library
Every PV & BESS failure mode we detect
Integrations
Huawei, Tesla Megapack, and the data we ingest
Insights
Warranty disputes, soiling economics, PPA guarantees
Latest writing
Why cell-level BMS monitoring is no longer enough in 2026
The failures putting BESS assets at risk increasingly live in the balance-of-system, cooling, HVAC, connections, which the BMS was never designed to see.
Augment or overbuild? How analytics defers the spend
Augmentation timing is one of the biggest line items in a storage business case, and it is set by your real degradation rate, not the warranty’s conservative curve.
How inverter clipping hides your soiling losses
When an inverter is clipping, moderate soiling and string losses can vanish from the AC data, the plant looks stable while yield quietly leaks under the cap.
Why we’re leading with BESS in 2026, and the warranty mistake we keep seeing
Battery storage is where the operational money and risk now sit. The recurring mistake: treating the warranty as a filed document instead of a live data position.
What the Iberian blackout exposed about BESS readiness
The April 2025 Iberian blackout was a stress test for storage. The assets that came through best belonged to operators who already knew their batteries’ real state.
Soiling season is here: a field note on when cleaning actually pays
It’s June, the rain has stopped across Iberia and the Gulf, and soiling is climbing. A short note on resisting the fixed-calendar clean and letting the numbers decide.
Common questions from operators
Get a custom ROI calculation and a pilot plan tailored to your plants.